|
|
|
|
|
Name
Cash Bids
Market Data
News
Ag Commentary
Weather
Resources
|
Nvidia's Free Cash Flow Falters From Higher Capex - Is NVDA Stock Fully Valued?/NVIDIA%20Corp%20logo%20outside%20building-by%20BING-JHEN_HONG%20via%20iStock.jpg)
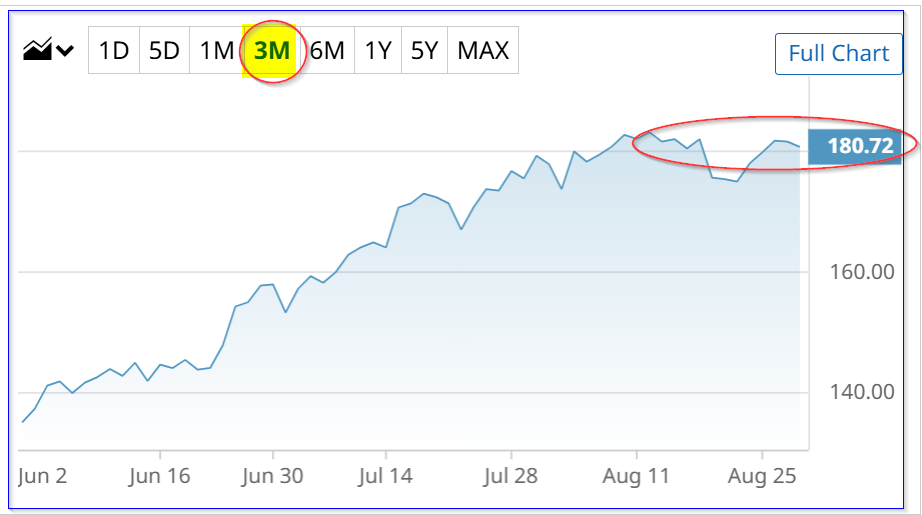
Nvidia Corporation (NVDA) said yesterday that its fiscal Q2 sales were up just 6% from the prior quarter, and free cash flow (FCF) fell slightly from a year ago. Moreover, its FCF margins have faltered with higher capex spending. Is NVDA stock overvalued now? NVDA closed at $180.17 on Aug. 28 in after-hours trading, down about 1% from the day before. Moreover, it's been essentially flat for the past month. Have investors lost interest in the NVDA stock, given the company's tepid performance and outlook? 
Tepid ResultsFor example, Nvidia reported that its non-GAAP gross margins (GM) in fiscal Q2 2026, ending July 27, 2025, were lower than a year ago (i.e., 72.4% vs. 75.0% in fiscal Q2 2025). Moreover, the company said in its outlook section that it expects the fiscal Q3 margin to be just 73.5%. In addition, its free cash flow (FCF) for fiscal Q2 2026 was just $13.45 billion, compared to $13.483 billion a year ago. However, that lower FCF was due to significantly high capital expenditures (capex). For example, a year ago, the company spent $977 million in fiscal Q2 2025. But that almost doubled (+93.9%) to $1.894 billion this past quarter (Q2 2026). That led to a much lower FCF margin. Its FCF as a percent of sales fell from 44.98% a year ago to just 28.82% in fiscal Q2 2026. That is based on analysis from Stock Analysis. Moreover, Stock Analysis says its trailing 12-month (TTM) FCF margin was just 43.59% in Q2, vs. 48.52% in Q1 (again, on a TTM basis). The point is that, based on the company's heavy AI buildout, its cash flow margins have been squeezed. That could affect its target value going forward. Target ValueFor example, assuming it makes just a 43% FCF margin over the next 12 months (NTM), its FCF growth could sputter. Here's why. Analysts are now expecting 2025 sales to be $204.33 billion and $266.33 billion next year. So, its run rate NTM sales are estimated to be $235.33 billion. Applying a 43% FCF margin to this NTM revenue estimate results in a FCF estimate of just over $101 billion: 0.44 x $235.33 billion = $101.19 billion NTM FCF If we assume the market will give the company a 2.0% FCF yield, its market value will be: $101b FCF / 0.02 = $5,050 billion market cap That is just 14.9% higher than Nvidia's market cap today of $4,394 billion, according to Yahoo! Finance. In other words, NVDA stock is likely to be worth +14.9% more over the next 12 months: $180.17 x 1.149 = $207 per share Analysts AgreeAnalysts surveyed by Yahoo! Finance have an average price target of just $201.98 per share. That is just 12.1% higher than today's close. Other analyst surveys are just as hesitant about NVDA stock's value. For example, Stock Analysis shows that 45 analysts have an average price target of $203.00 per share. Moreover, Barchart's mean target price survey is just $199.28. However, AnaChart.com, which covers recent analyst write-ups, says that 39 analysts have a price target average of $217.60. So, the average range is between $202 and $217, or $209.50. That is close to my estimate of $207 for the next 12 months. How To Play NVDA StockGiven the tepid outlook for the company and its valuation, it might make sense for value investors to simply wait. There is always a chance to buy at a lower price or dip. After all, the average outlook is for a stock price between $207 and 210, or just +15.7% higher over the next 12 months. It can be difficult for investors to wait before buying a popular stock sometimes. But the fact that NVDA has been flat for the last month, even after its latest results, might point to a certain tiredness with the company's valuation. That could be all the more the case if its FCF margins continue to falter. The bottom line is that value investors should be patient with NVDA stock and look for a better buy-in opportunity. On the date of publication, Mark R. Hake, CFA did not have (either directly or indirectly) positions in any of the securities mentioned in this article. All information and data in this article is solely for informational purposes. For more information please view the Barchart Disclosure Policy here. |
|
|